Run graph algorithms
Network analysis is a field of data science and graph theory focused on understanding the connections and interactions between entities in a graph. By examining the structure and dynamics of these networks, analysts can reveal important properties such as influential nodes, community structures, and information flow. Applications of network analysis span diverse areas, including identifying key players in social networks, detecting fraud in financial systems, optimizing transportation routes, and mapping the spread of diseases in healthcare.
When working with Ladybug, you can run graph algorithms in one of two ways:
algoextension: Run graph algorithms natively in Ladybug via the algo extension.networkx: Use the NetworkX library in Python to run almost any graph algorithm on a Ladybug subgraph.
Prepare the dataset
A dataset of Nobel laureates and their mentorship network is provided here. Download the dataset to your local directory and unzip it.
The nodes in the dataset are scholars who won Nobel prizes, as well as other scholars who didn’t win prizes but were involved in mentoring them. The edges represent mentor-mentee relationships between the scholars. Laureates who won prizes in Physics, Chemistry, Medicine, and Economics are in the dataset.
To run the code examples below, you can install the following dependencies:
uv inituv add lbug polars pyarrow networkx numpy scipyCreate the graph
First, initialize a connection to a new Ladybug database named example.lbdb:
from pathlib import Pathimport ladybug as lb
db_path = "example.lbdb"
Path(db_path).unlink(missing_ok=True)Path(db_path + ".wal").unlink(missing_ok=True)
db = lb.Database(db_path)conn = lb.Connection(db)
There will be one node table Scholar, and one relationship table MENTORED in this graph:
# Node table schemaconn.execute( """ CREATE NODE TABLE Scholar( name STRING PRIMARY KEY, prize STRING, year INT64, is_laureate BOOLEAN DEFAULT false ); """)# Relationship table schemaconn.execute("CREATE REL TABLE MENTORED(FROM Scholar TO Scholar);")The node data can be ingested into Ladybug using MERGE commands as follows:
res = conn.execute( """ LOAD FROM './data/scholars.csv' (header=true) MERGE (s:Scholar {name: name}) SET s.prize = category, s.year = year, s.is_laureate = is_laureate RETURN COUNT(s) AS num_scholars; """)print(f"Merged {res.get_as_pl()['num_scholars'][0]} scholar nodes into the database")The relationship data can also be similarly ingested:
res = conn.execute( """ LOAD FROM './data/mentorships.csv' (header=true) MATCH (s1:Scholar {name: mentor}), (s2:Scholar {name: mentee}) MERGE (s1)-[:MENTORED]->(s2) RETURN COUNT(*) AS num_mentorships; """)print(f"Merged {res.get_as_pl()['num_mentorships'][0]} mentorship relationships into the database")You should see the following output:
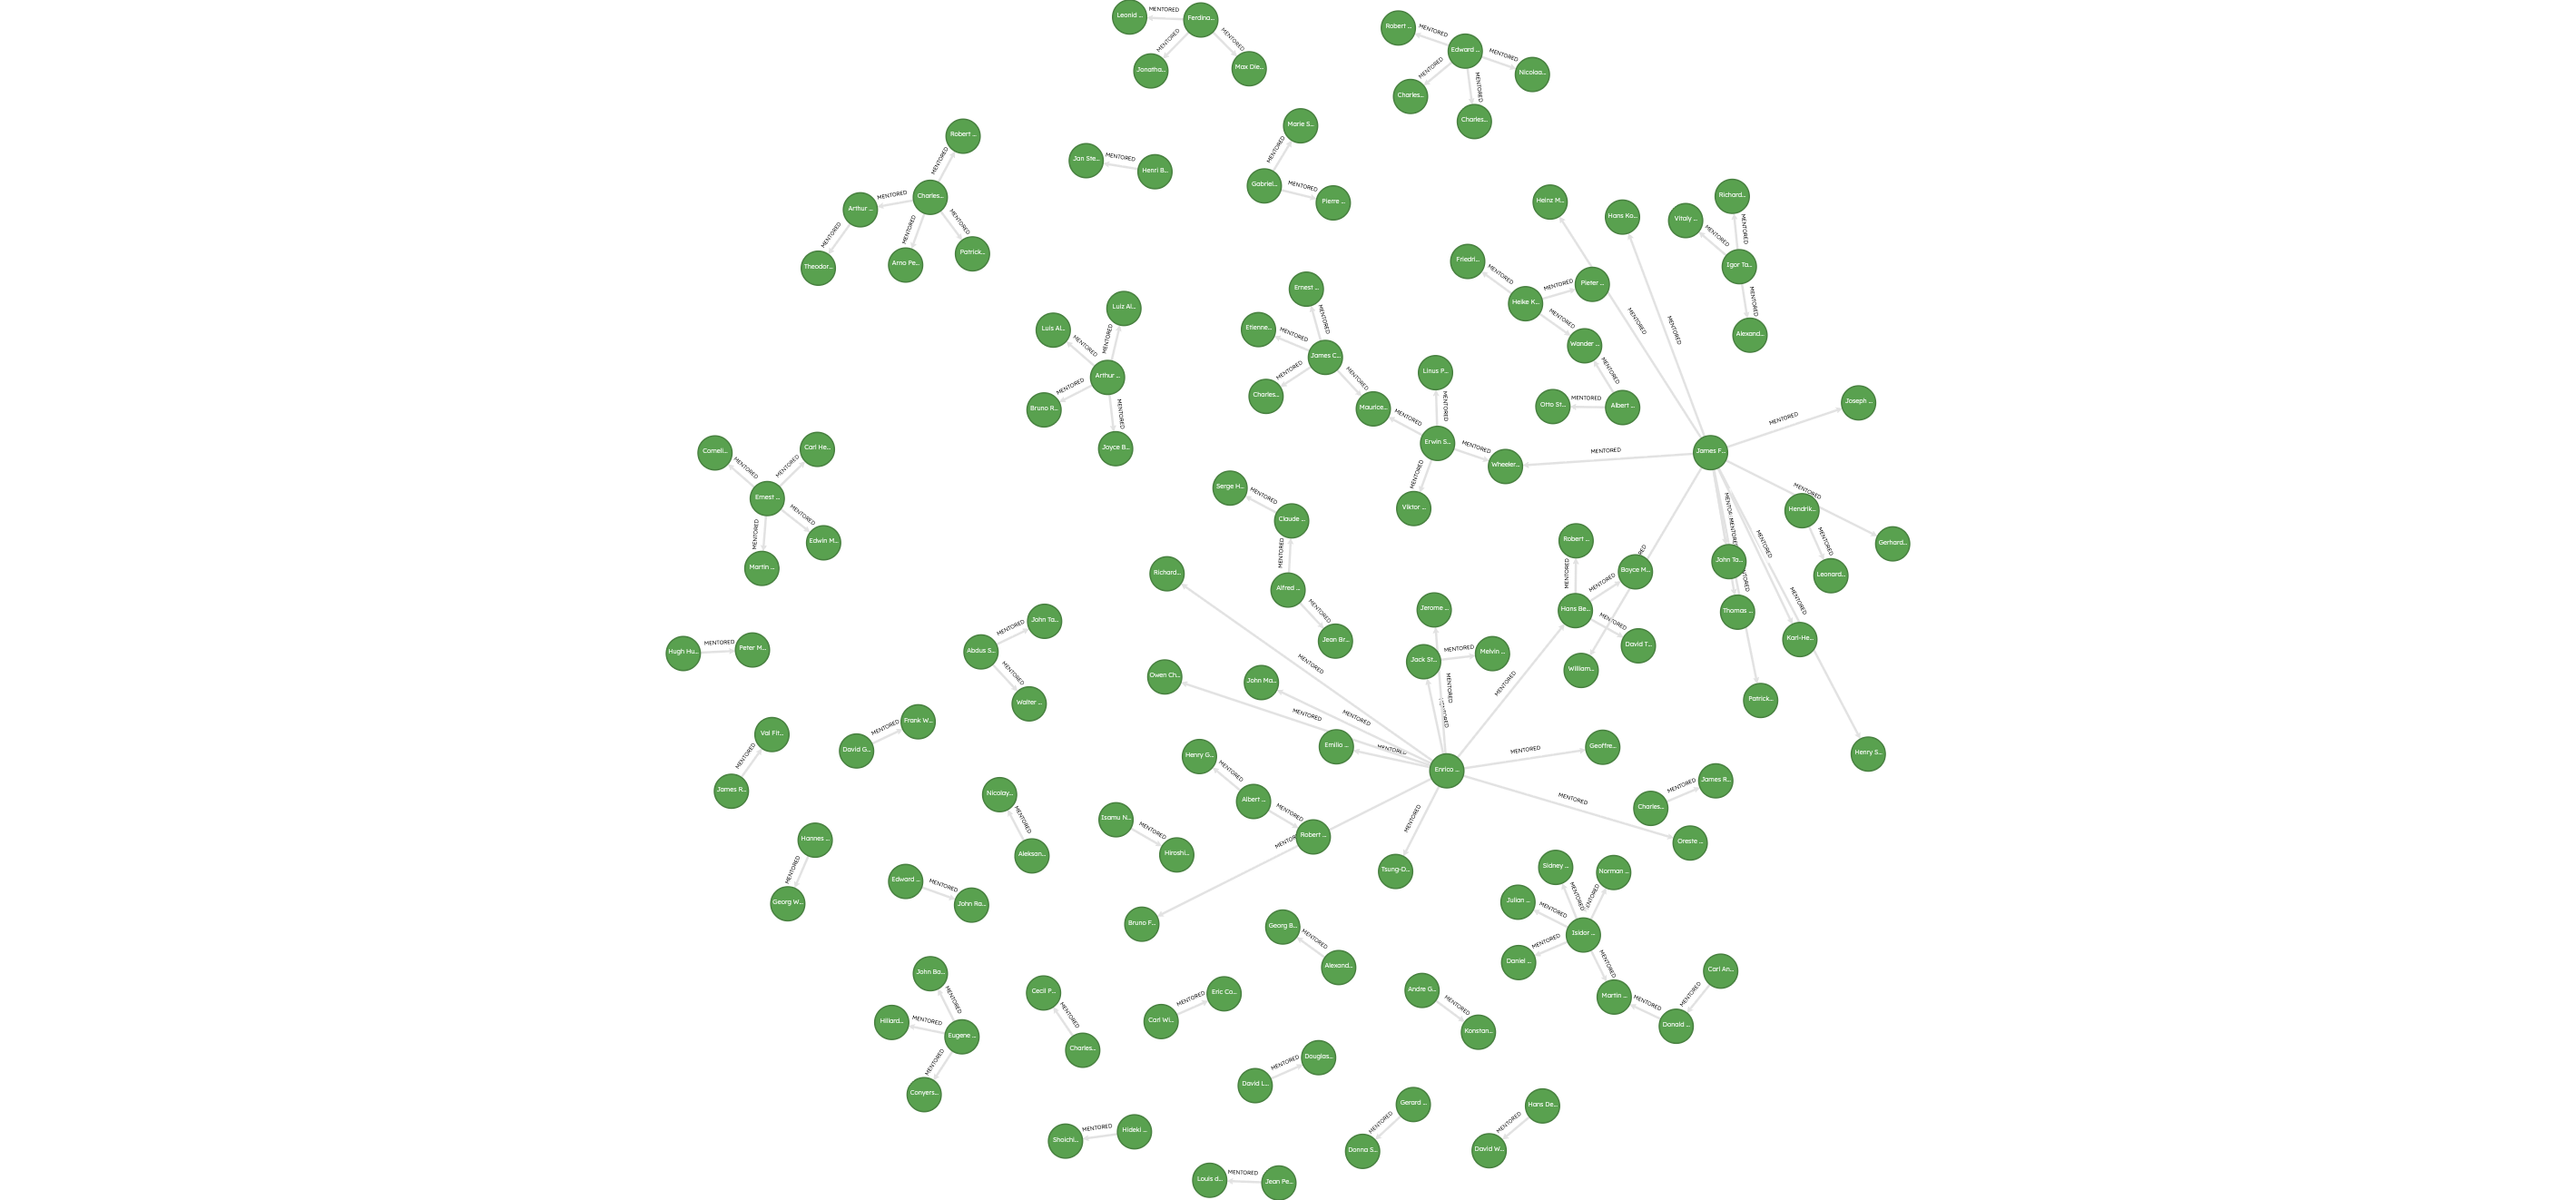
Merged 3384 scholar nodes into the databaseMerged 5657 mentorship relationships into the databaseThe resulting graph can be visualized using Ladybug Explorer, and shows rich connections between scholars who mentored one another.
Now that you’ve loaded the mentorship graph, you’re ready to run graph algorithms on it!
Method 1: Ladybug algo extension
The first method to run a graph algorithm natively in Ladybug is using the algo extension.
Install and load the extension
import ladybug as lb
db_path = "example.lbdb"
db = lb.Database(db_path)conn = lb.Connection(db)
# Install and load the Ladybug algo extensionconn.execute("INSTALL algo; LOAD algo;")
Project a subgraph
When using the algo extension in Ladybug, graph algorithms run
on a projected subgraph.
conn.execute("CALL project_graph('MentorshipGraph', ['Scholar'], ['MENTORED']);")Run PageRank
Run the PageRank algorithm on the projected subgraph and collect the results in a Polars DataFrame. You can alternatively use Pandas DataFrames if you wish.
# Run PageRank on the projected graphres = conn.execute( """ CALL page_rank('MentorshipGraph') RETURN node.name AS name, rank AS pagerank; """)# Get the PageRank results in a Polars DataFramepagerank_df = res.get_as_pl()Write results to Ladybug
The above steps computed the PageRank metrics for the nodes, but didn’t persist them to the Ladybug database.
To do this, you can use the pagerank_df DataFrame to write the PageRank scores to the Scholar node table.
To ingest the data back in, first run ALTER TABLE to add a new column
pagerank to the Scholar node table:
# Add a new column pagerank to the Scholar node tableconn.execute("ALTER TABLE Scholar ADD IF NOT EXISTS pagerank DOUBLE DEFAULT 0.0;")Then, MERGE the scholar names from the DataFrame (which will match on the existing name value
in the Scholar node table) and persist the PageRank scores to the node table:
conn.execute( """ LOAD FROM pagerank_df MERGE (s:Scholar {name: name}) SET s.pagerank = pagerank; """)print("Finished adding graph algorithm metric scores to Ladybug database")You can test that the results were ingested correctly in Ladybug by running the following query:
res = conn.execute( """ MATCH (s:Scholar) WHERE s.prize = "Physics" RETURN s.name, s.pagerank ORDER BY s.pagerank DESC LIMIT 5; """)print(res.get_as_pl())┌────────────────────────┬────────────┐│ s.name ┆ s.pagerank ││ --- ┆ --- ││ str ┆ f64 │╞════════════════════════╪════════════╡│ Adam Riess ┆ 0.00083 ││ Nicolaas Bloembergen ┆ 0.000696 ││ Heike Kamerlingh Onnes ┆ 0.00056 ││ Claude Cohen-Tannoudji ┆ 0.000456 ││ Chen-Ning Yang ┆ 0.000455 │└────────────────────────┴────────────┘You can also run the following query in Ladybug Explorer to visualize the tree structure that led to the person with the highest PageRank score:
MATCH (a:Scholar)-[r*1..10]-(b)WHERE a.name = "Adam Riess"RETURN *LIMIT 10;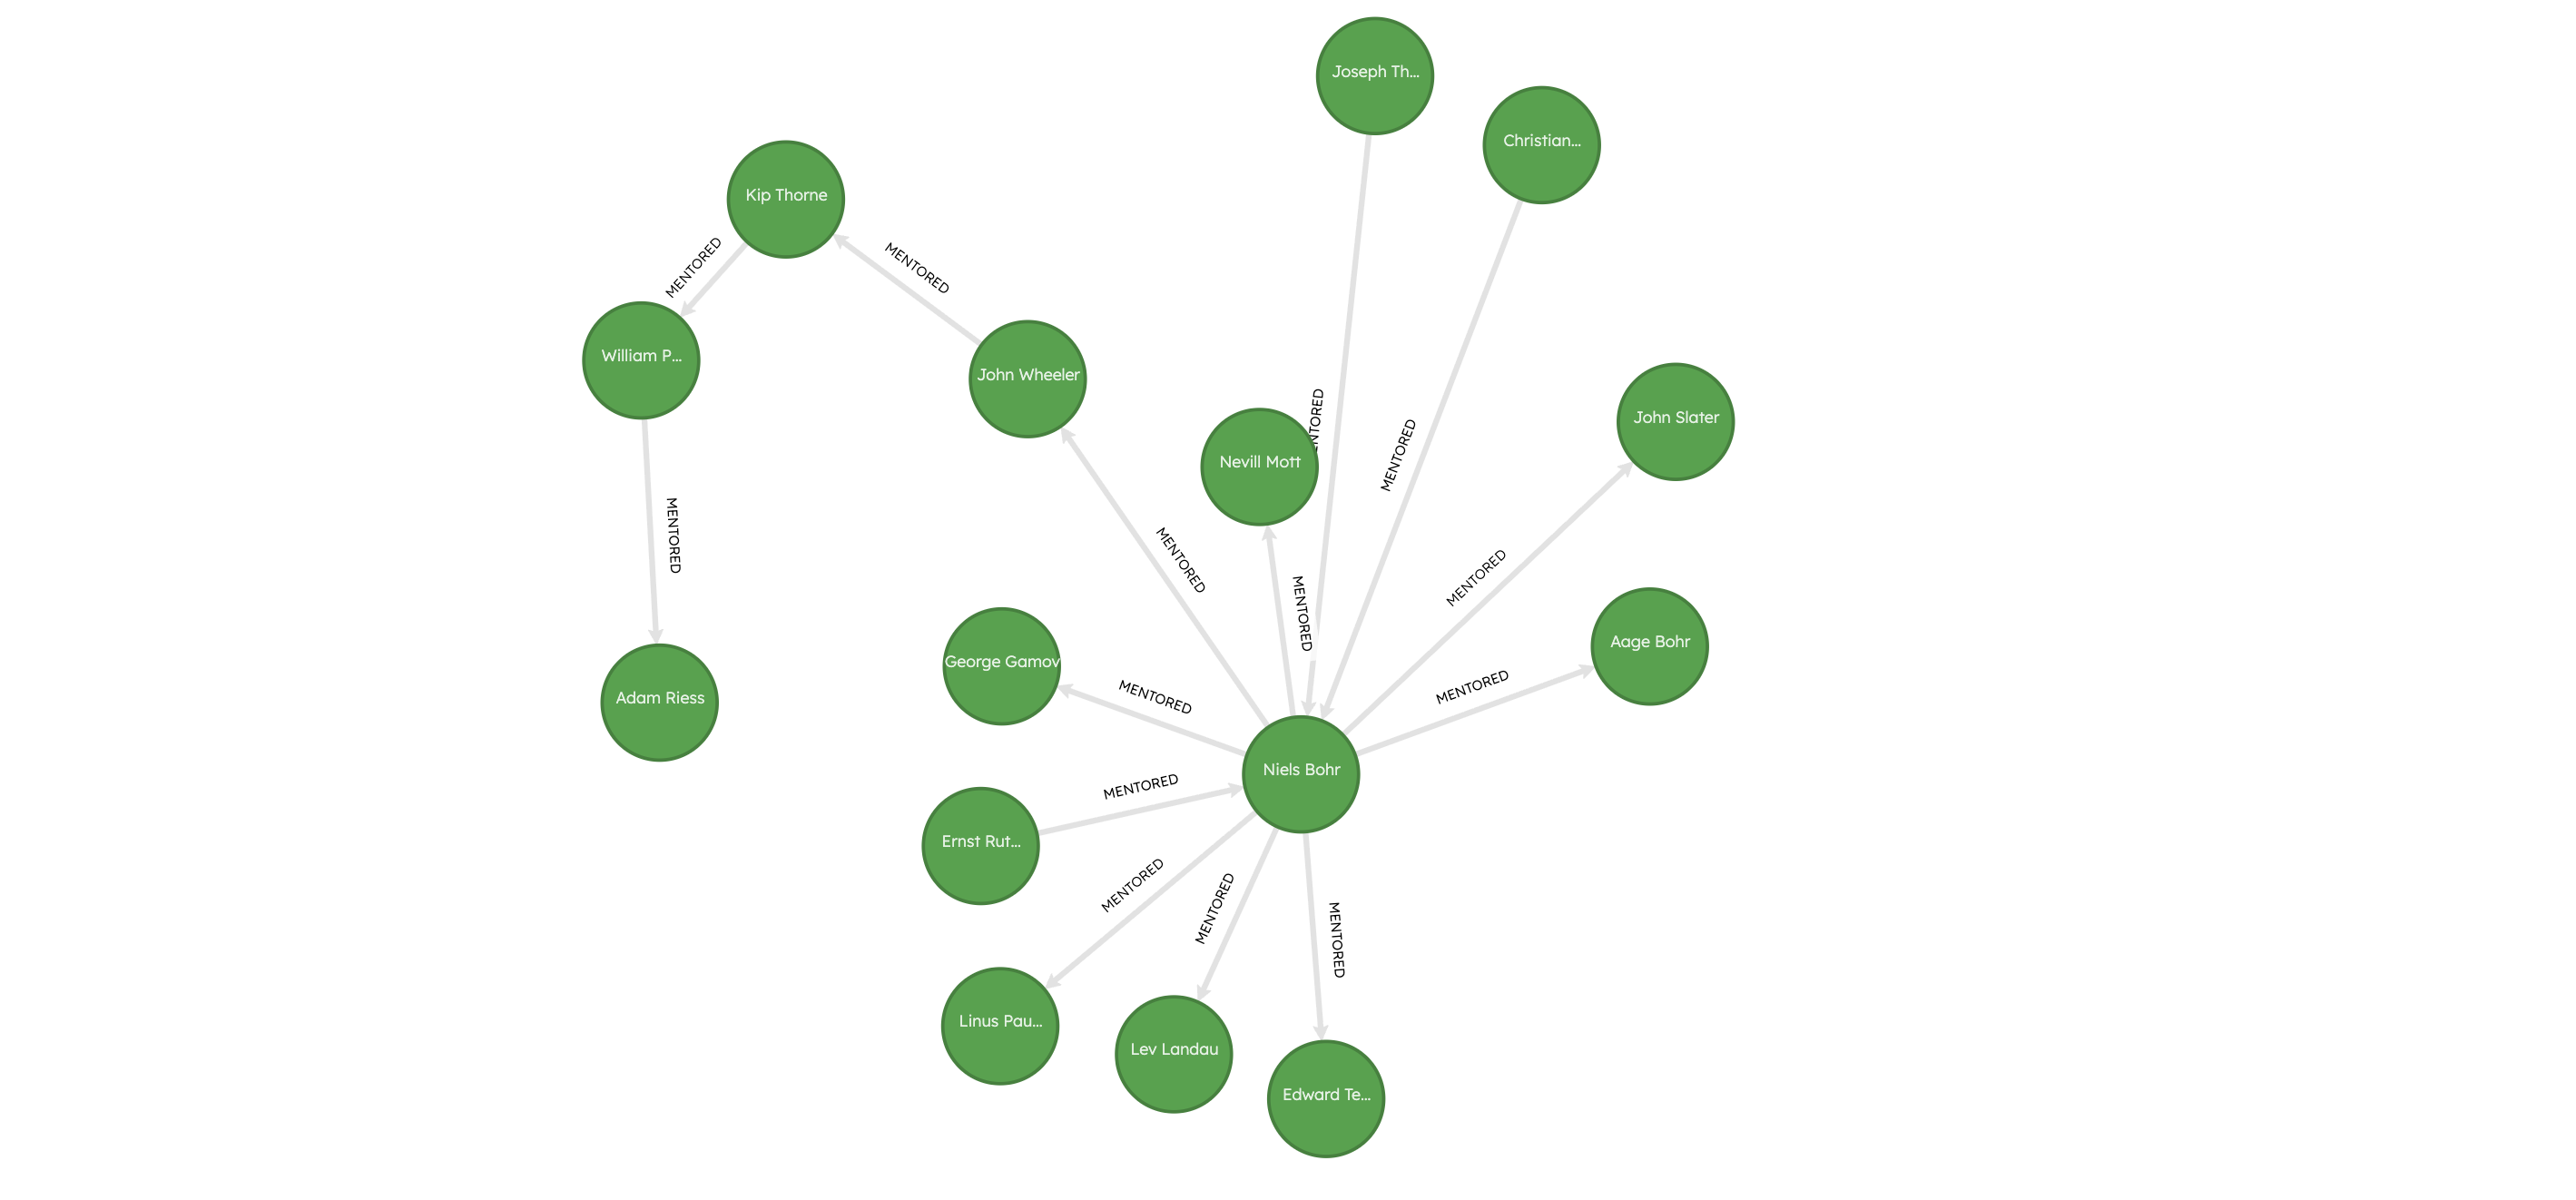
Adam Riess, who has the highest PageRank score, has notable academic ancestors such as Kip Thorne, John Wheeler, Niels Bohr, going all the way back to Ernest Rutherford and J.J. Thomson! The high PageRank score for Adam Riess can be attributed to his presence in a part of the network that has many other influential scholars, such as Niels Bohr, Ernest Rutherford, J.J. Thomson, Edward Teller, and Linus Pauling.
Method 2: NetworkX
You can also run graph algorithms via NetworkX. This involves transforming a Ladybug subgraph into a NetworkX graph object, running the algorithm on it, and then writing the results back to Ladybug.
First, obtain a connection to the existing example.lbdb database:
import ladybug as lb
db_path = "example.lbdb"
db = lb.Database(db_path)conn = lb.Connection(db)
Create a NetworkX graph
The first step is to extract a subgraph from Ladybug and convert it to a NetworkX graph object.
# Convert a Ladybug subgraph to a NetworkX graphres = conn.execute( """ MATCH (a:Scholar)-[b:MENTORED]->(c:Scholar) RETURN * """)nx_graph = res.get_as_networkx()Then, run the PageRank algorithm on the NetworkX graph as follows:
import networkx as nximport polars as pl
pageranks = nx.pagerank(nx_graph)# NetworkX prefixes the node label to the results# This step cleans up the naming so that we can import it back into Ladybugpagerank_df = (    pl.DataFrame({"name": k, "metric": v} for k, v in pageranks.items())    .with_columns(pl.col("name").str.replace("Scholar_", "").alias("name")))
The results from NetworkX are transformed into a Polars DataFrame and the columns are renamed appropriately, to match with the node table’s columns in Ladybug.
Write NetworkX results to Ladybug
To ingest the data back in, first run ALTER TABLE to add a new column
pagerank to the Scholar node table. Then, scan the data from the Polars
DataFrame and merging the results into the Scholar node table.
# Add a new column pagerank to the Scholar node tableconn.execute("ALTER TABLE Scholar ADD IF NOT EXISTS pagerank DOUBLE DEFAULT 0.0;")
conn.execute(    """    LOAD FROM pagerank_df    MERGE (s:Scholar {name: name})    SET s.pagerank = metric;    """)print("Finished adding graph algorithm metric scores to Ladybug database")
We can test that the results were ingested correctly in Ladybug by running the following Cypher query:
# Query scholars with the highest PageRank scores who won Nobel prizes in Physicsres = conn.execute( """ MATCH (s:Scholar) WHERE s.prize = "Physics" RETURN s.name, s.pagerank ORDER BY s.pagerank DESC LIMIT 5 """)print(res.get_as_pl())┌────────────────────────┬────────────┐│ s.name ┆ s.pagerank ││ --- ┆ --- ││ str ┆ f64 │╞════════════════════════╪════════════╡│ Adam Riess ┆ 0.001657 ││ Nicolaas Bloembergen ┆ 0.001402 ││ Heike Kamerlingh Onnes ┆ 0.001153 ││ Claude Cohen-Tannoudji ┆ 0.00092 ││ Chen-Ning Yang ┆ 0.000913 │└────────────────────────┴────────────┘Run any other algorithm in NetworkX
You can just as easily run any other algorithms supported by NetworkX. The example below shows the results of the betweenness centrality algorithm run on the same graph.
# Run betweenness centralitybc_results = nx.betweenness_centrality(nx_graph)# NetworkX prefixes the node label to the results# This step cleans up the naming so that we can import it back into Ladybugbetweenness_centrality_df = ( pl.DataFrame({"name": k, "metric": v} for k, v in bc_results.items()) .with_columns(pl.col("name").str.replace("Scholar_", "").alias("name")))The following command adds a new column betweenness_centrality to the Scholar node table:
conn.execute("ALTER TABLE Scholar ADD IF NOT EXISTS betweenness_centrality DOUBLE DEFAULT 0.0;")Then, write the results back to the Ladybug database as before:
conn.execute( """ LOAD FROM betweenness_centrality_df MERGE (s:Scholar {name: name}) SET s.betweenness_centrality = metric; """)print("Finished adding graph algorithm metric scores to Ladybug database")The query below shows the top 5 Physics laureates with the highest betweenness centrality scores and the number of mentors and mentees for each of them.
res = conn.execute( """ MATCH (s:Scholar), (a:Scholar)-[:MENTORED]->(s)-[:MENTORED]->(b:Scholar) WHERE s.prize = "Physics" AND a.is_laureate = true AND b.is_laureate = true RETURN s.name, s.betweenness_centrality, COUNT(DISTINCT a) AS num_mentors, COUNT(DISTINCT b) AS num_mentees ORDER BY s.betweenness_centrality DESC LIMIT 5; """)print(res.get_as_pl())The results show that some well-known Physics Nobel laureates emerge as key players based on their betweenness centrality scores.
┌─────────────────┬──────────────────────────┬─────────────┬─────────────┐│ s.name ┆ s.betweenness_centrality ┆ num_mentors ┆ num_mentees ││ --- ┆ --- ┆ --- ┆ --- ││ str ┆ f64 ┆ i64 ┆ i64 │╞═════════════════╪══════════════════════════╪═════════════╪═════════════╡│ Joseph Thomson ┆ 0.00254 ┆ 1 ┆ 11 ││ Max Born ┆ 0.002367 ┆ 1 ┆ 8 ││ Niels Bohr ┆ 0.00179 ┆ 2 ┆ 10 ││ Robert Millikan ┆ 0.00082 ┆ 2 ┆ 2 ││ Wolfgang Pauli ┆ 0.000654 ┆ 2 ┆ 1 │└─────────────────┴──────────────────────────┴─────────────┴─────────────┘Conclusions
By using centrality metrics like PageRank and betweenness centrality to analyze the neighborhood of nodes in the mentorship graph of Nobel laureates and scholars, you were able to gain new insights without much prior knowledge of the data. This demonstrates the power of graph algorithms and network analysis in uncovering insights from complex data.
For performance and scalability, it’s recommended to use Ladybug’s native algo extension if your algorithm of choice
is available. If not, you can always fall back to using NetworkX, which has a far more extensive suite of
graph algorithms.
To reproduce the analysis shown in this tutorial, run the code snippets above after placing the CSV files in ./data.